Fokus Desktop
Fokus shows the relevant information in terms of guidance compiled and identifies students who are not progressing at the target pace.
In addition to the PLP functions, students receive activity-based statistics, comprehensive study monitoring and a forecast of the graduation date.
Fokus visualizes things clearly and the student can also see the workload of studies on a weekly basis.
The best benefit from Fokus is obtained when the students’ PLP and timings are up-to-date and planned for the entire scope of the studies.
Start
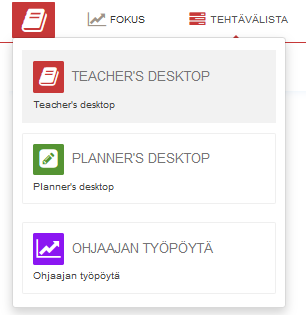
Choose Ohjaajan työpöytä from Peppi. This desktop is visible only to those who have been granted the rights, for example career tutors.
Search
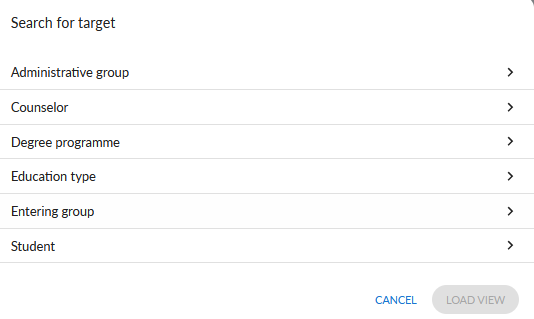
Choose Search for target.
- According to the Administrative group, you can search for example according to the specialization: Sport business, or according to other special administrative groups made in Peppi. A specific student group (e.g. HTL20SA, SAR21S1) is applied for in the Entering group section.
- You can search from Counsellor with your name or someone else’s name.
- You can search degree program.
- From Education type you will see for example all the Jamk Open University of Applied Sciences.
Buttons
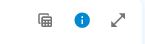
The Info button always tells you “How to interpret any information”
The table button shows information as table the table view
Show Expanded shows the table or graph wider.
Students group – Entering group and settings
Note! The same instructions also apply to monitoring an entire degree program or other group.
Enter the name of the group in the Search field.
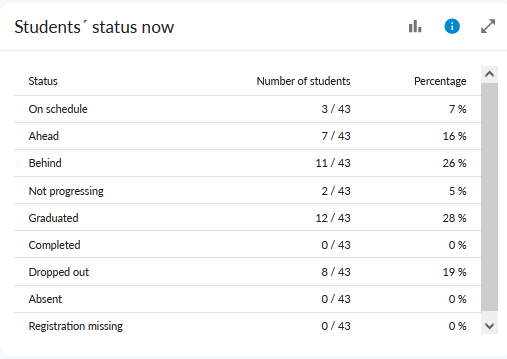
Students’ status now
The Info button always tells you “How to interpret any information”
The Students’ status now graph shows the situation of students in the reporting group according to their study status. The status is presented according to the current semester, and the review period selected in the settings does not affect the content of the graph.
On time – The student’s credit accumulation at the beginning of the semester has been in accordance with the target rate of 30 credits per semester.
Not progressing – The student’s credit accumulation in the most recent full and current attendance period is less than 5 credits in total.
The “Studies completed” status usually has Open Path students who have completed their studies. So, they are participating in the group for the second time also as degree students, just like on Peppi. In the settings, you can filter out Jamk Open University of Applied Sciences path students. (Instructions later below).
You can move the mouse in the points of the graphs, and you will get numerical information.
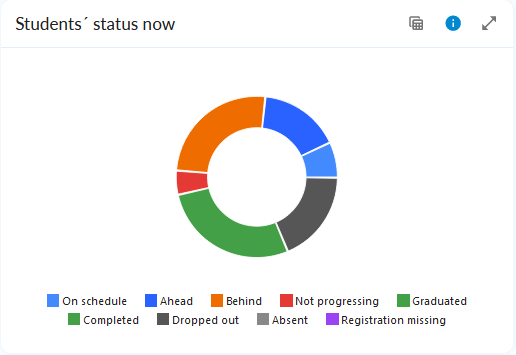
You can change the chart to a table from the button.
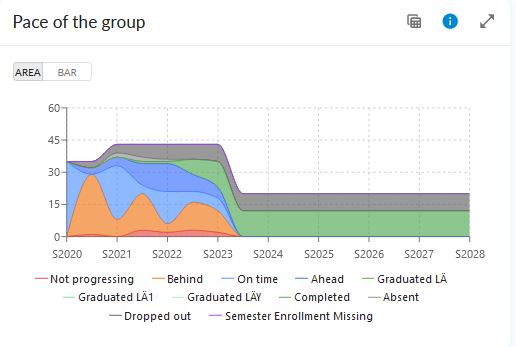
Pace of the group
Pace of the group chart displays the development of the reporting group’s situation by semester. You can change the semesters to be viewed in the view settings. The area chart provides a clearer view of trends, while the bar chart shows the situation for individual semesters.
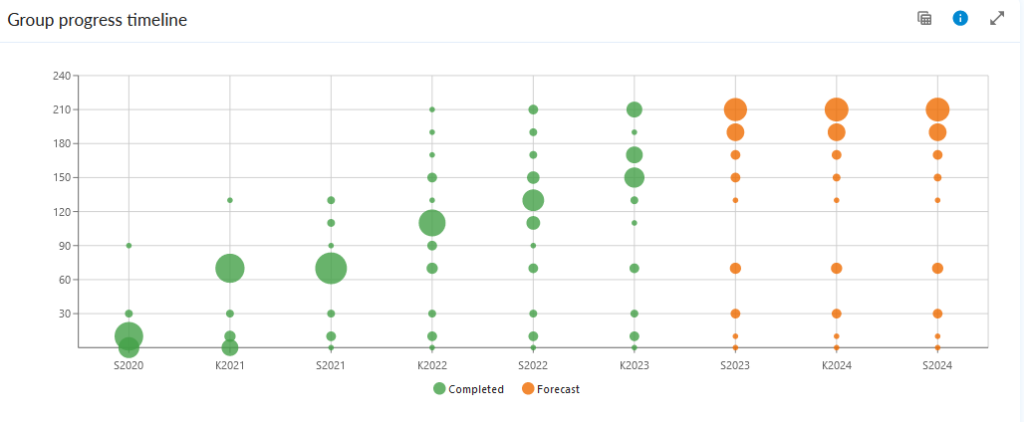
Group progress timeline
Group progress timeline gives you an overview on the accumulation of credit points in the student group. The forecast counts for current and scheduled courses in addition to completed credits.
You can move the mouse in the points of the graphs, and you will get numerical information.
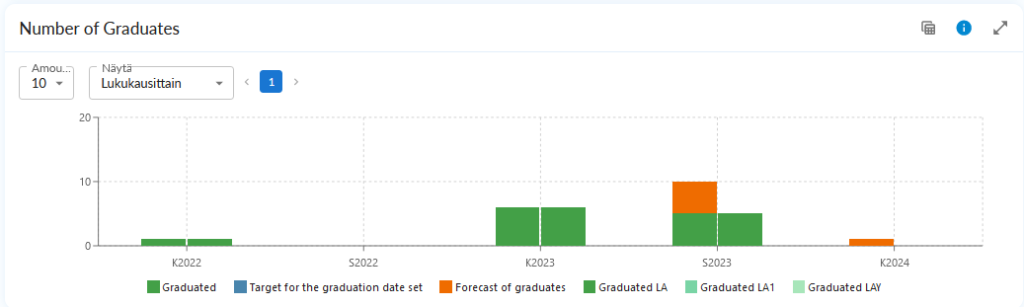
Number of graduates
Number of graduates is shown per semester. The forecast values are based on students’ personal study plans, and it is assumed that the studies follow the planned schedule. To estimate the graduation semesters, future courses must be scheduled for the entire degree.
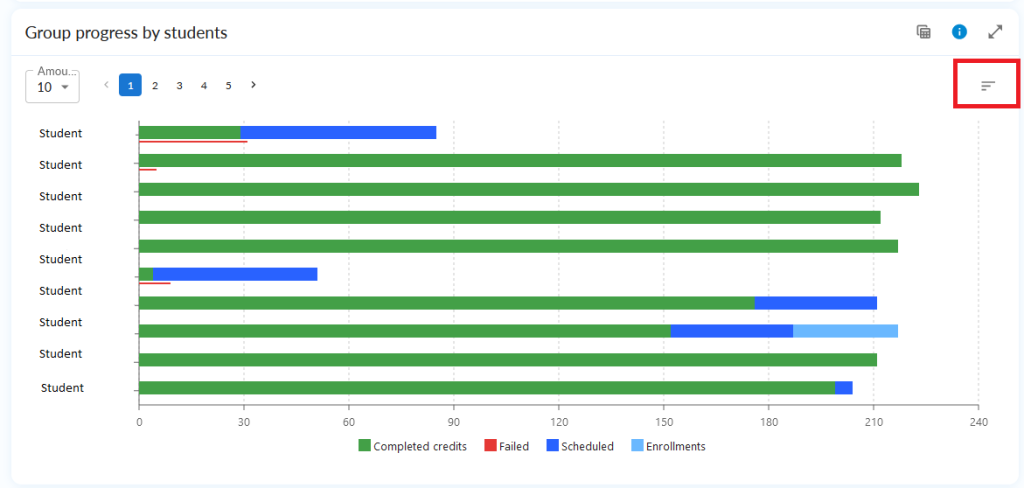
The group progress by students
The group progress by students graph displays the completed credit points and the credits of failed courses for the students in the reported group, the credits of enrolled implementations, and the credits of studies scheduled in PLP. The graph can be used to assess both students’ performance and the scope of planned studies in relation to the scope of the degree.
You can choose the sort order from the button on the right.
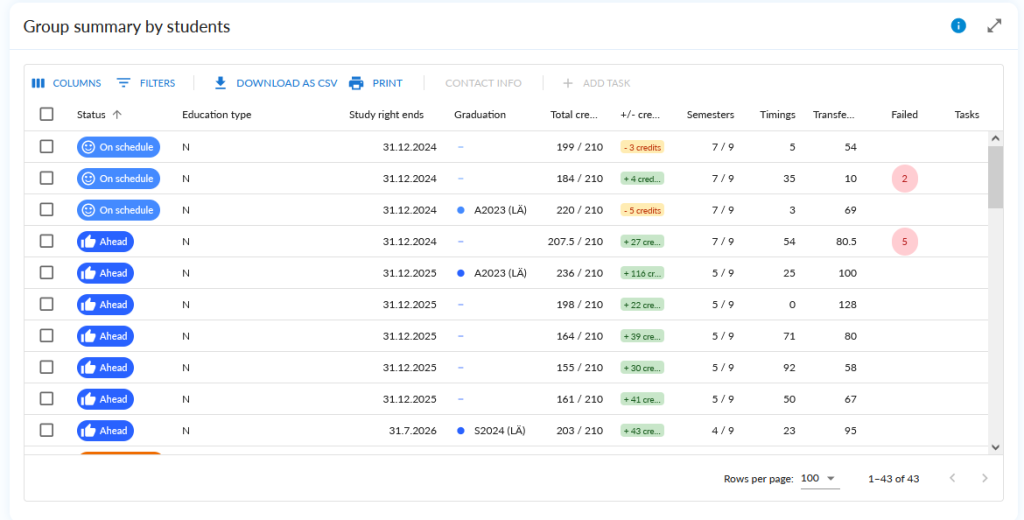
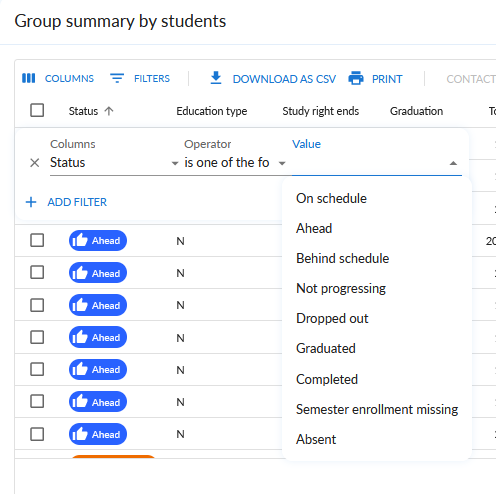
Group summary by students
Group summary by students table displays key statistics and metrics for the reported target group on a student-by-student basis. With the choices above the table, you can select the columns to be displayed, filter the student list according to specified column, export the data to CSV, and print to PDF. You can change the order of the list by clicking on the desired column header.
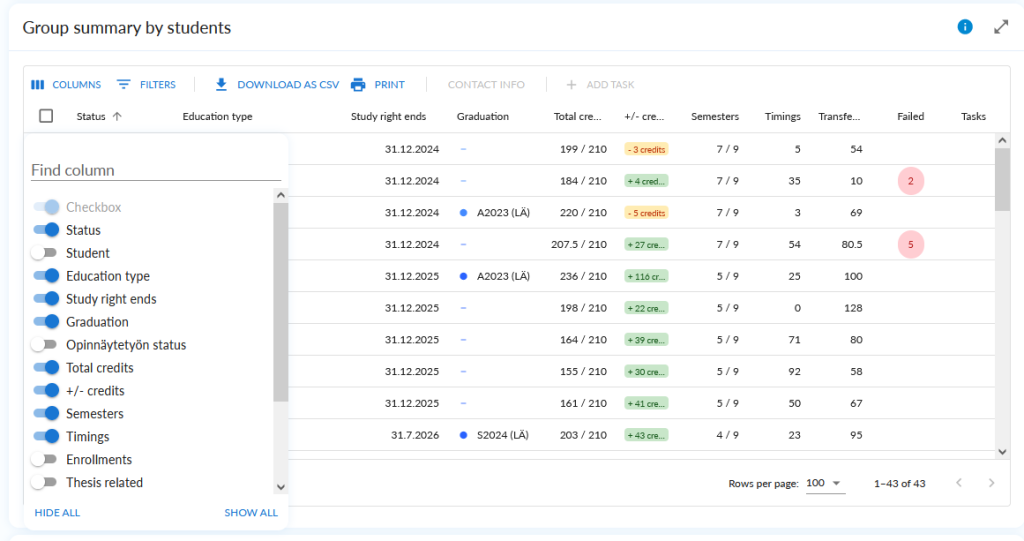
Use the buttons to select the columns you want to see.
By filtering, you can filter to display, for example, graduates or those students whose studies are not progressing.
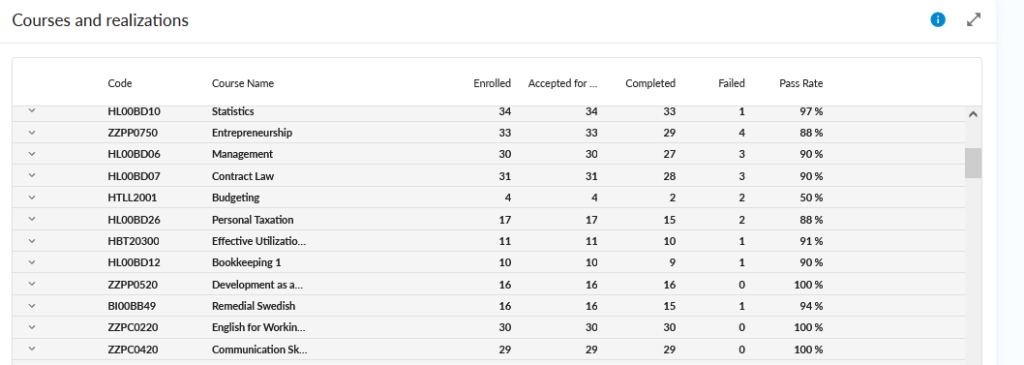
Courses and realizations
The table includes the course implementations of the target group, for which the students have enrolled. The number of enrolled, approved for implementation, completed and rejected performances and the pass rate are seen as monitoring metrics. The pass rate is calculated as the ratio of those who completed to those approved for implementation. The metrics are presented at the study course and implementation level. With the report, it is possible to drill down into the implementation of study courses and further into individual students. You can sort the table by clicking on the column headings.
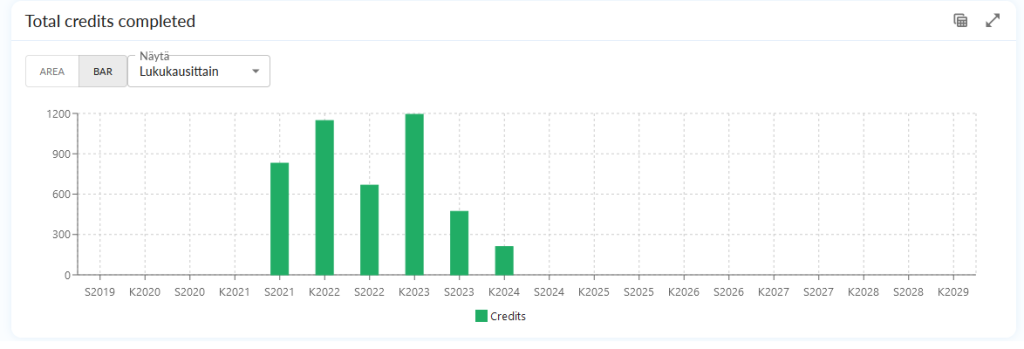
Total credits completed
Student groups credits total as graph. Näytä (Show) lukukausittain = by semester or Kalenterivuosittain = by year.
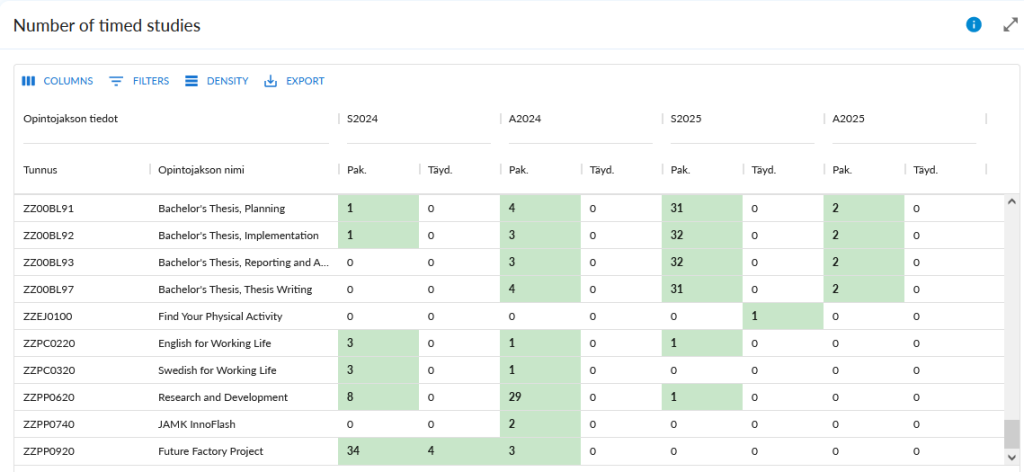
Number of timed studies
Through the number of timed studies, you can view how many students have scheduled a particular course for a given semester.
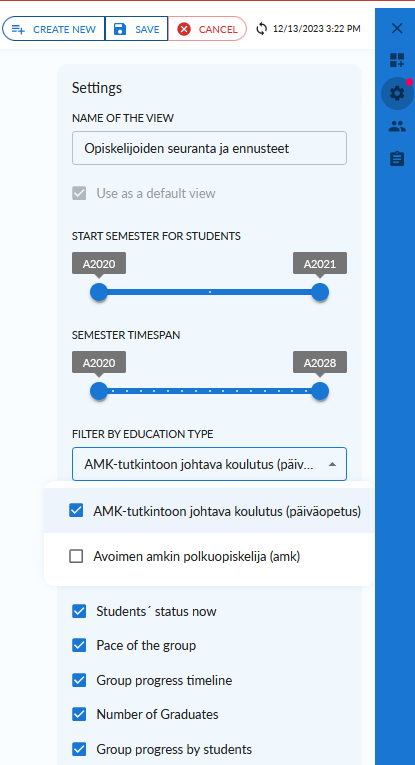
Settings, Views and Todo
From the blue bar, you can turn Settings on and off.
You can choose what information is displayed.
You can filter out Open as pathway students, if they have already transitioned to degree students. You can also filter by qualifier. You can use the sliders to select the starting semester or the semesters to be viewed. To create a new view, click Create New.
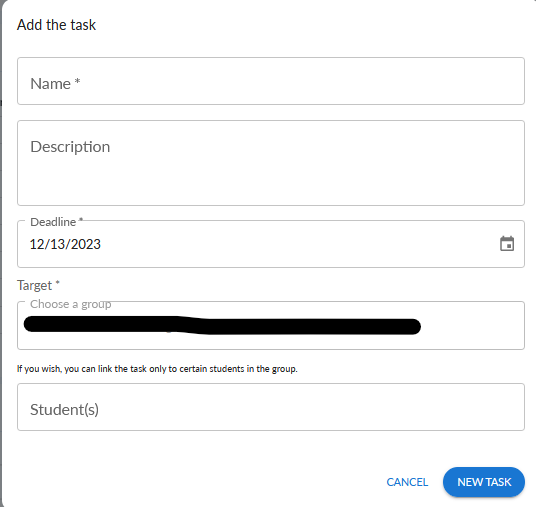
Todo
You can set the task either for the whole group or for individual students. Tap Add New Task. You can set yourself a task – for example, to check the progress of a certain group in January.
You can see all set tasks in the task list. You can access the Todo list from the Fokus homepage.
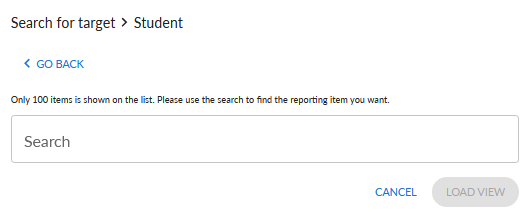
Individual student information, student’s view
You can search for an individual student’s information using the search. A student can have several study rights. For the right student, select the Load View button.
The view is the same for the instructor and the student. The instructor can also access the student’s view from the Students button, for example when viewing the Entering group.
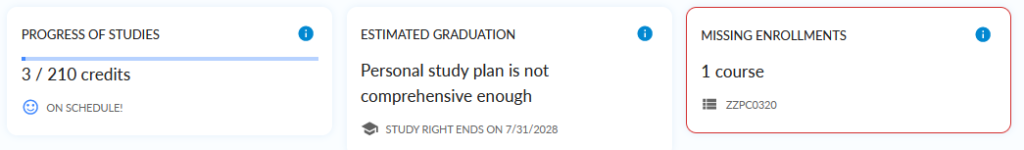
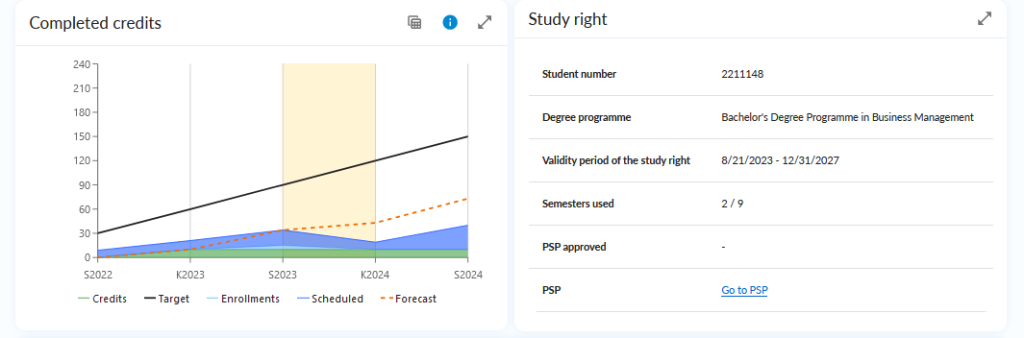
Progress of studies: Completed credits and the status of the studies. Status is based on the pace of the studies compared to target pace 30 credits per semester.
Estimated graduation: The estimate of your graduation semester is based on your completed credits and current plus scheduled studies. If your personal study plan is yet not prepared for your entire degree the estimate is not shown.
Missing enrolments: Scheduled courses for the current semester without an enrolment are considered missing
Completed credits as study right
Course timeline shows not only the registrations, but also the timings in the academic year.
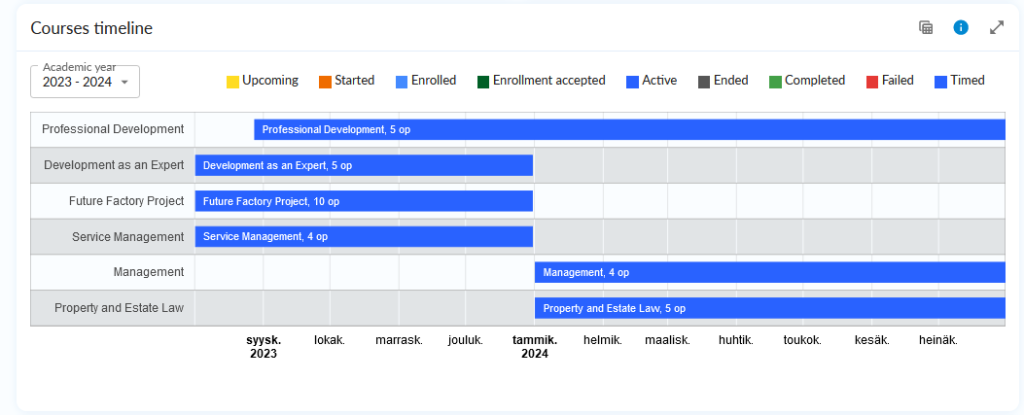
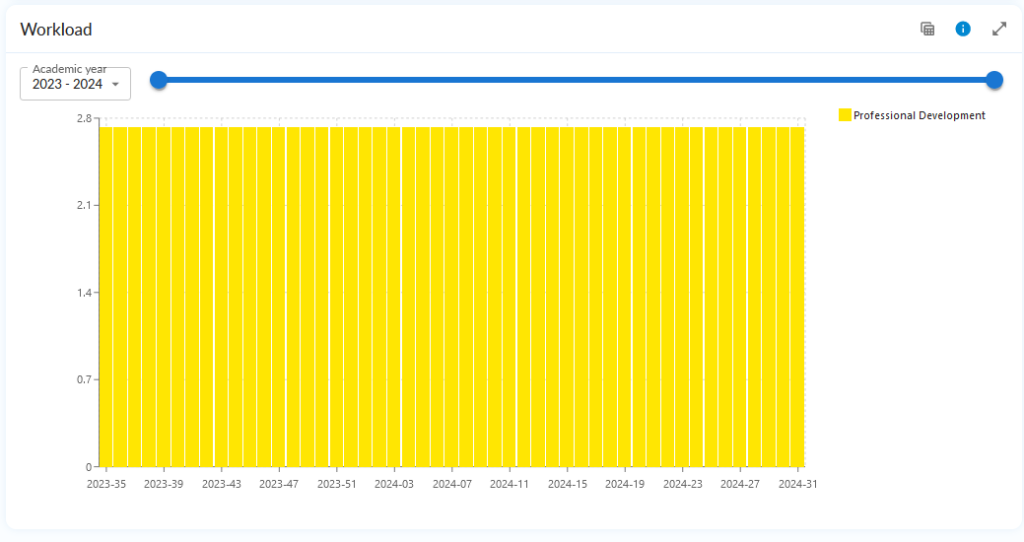
Workload shows the load in the selected academic year.