Monitoring graph -tab
With the monitoring graph, you can monitor the progress of the studies of the group’s students. The Monitoring graph tab is only visible on the My PLP groups and My groups tabs.
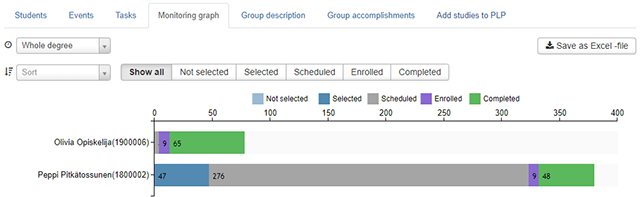
- From the drop-down menu, select the semester to be monitored, or Whole degree. In other words, you can monitor the student’s progress by semester or with regard to the whole degree.
- You can select the order in which the students are displayed from the drop-down menu. Based on your selection, the page will display the students in a descending order according to criteria such as the amount of studies completed. The sorting options include:
- Not selected
- Selected
- Scheduled
- Enrolled
- Completed
- You can select the criteria according to which the data will be displayed on the monitoring bar. Select Show all to display all the options.
- You can also download the data in Excel format by clicking the Save as Excel -file button